
Intro
Many people say that ggplot is a powerful package for visualization in R. I know that. But i’d never triggered to explore this package deeper (except just to visualize mainstream plot like pie chart, bar chart, etc.) till this post impressed me.
That post is about plotting map using ggplot. The pretty plots resulted on that post challenged me to explore ggplot more, especially in plotting map/spatial data.
Preparation
We always need data for any analysis. The author of those post use USA map data available in ggplot2 package. Though that post is reproducible research (data and code are available) menas i can re-run the examole on my own, but I want to go with local using Indonesia map data.
So, objective of this post is to visualize Indonesian population by province in Indonesia. So we need the two kinds of dataset. First is population data in province level and second is Indonesia map data. The first data is available in BPS site. The data consists of population density (jiwa/km2) for each province in Indonesia from 2000 till 2015. I will go with the latest year available on the data which is 2015.
Oke, now we arrive to the hardest part. I stacked for a while when searching Indonesia map data that suit for ggplot2 geom_polygon format. But Alhamdillah, after read some articles about kind of spatial data, I got one clue, I need shape data with .shp format to plot map data. And just by typing “indonesian .shp data” on google, He will provide us tons of link results. Finally, I got Indonesian .shp data from this site. I downloaded level 1 data (province level) for this analysis.
Data Acquisition
The fist step is load data into R. I use rgdal package to import .shp data. rgdal is more efficient in loading shape data compared to others package like maptools, etc.
|
|
Here’s one of the advantages using rgdal package, though it is in shape format we can use operation like names(), table(), and $ subset operation like in data frame format.
After data loaded into R workspace, we need to reformat shape data into format that suit to ggplot2 function.
|
|
|
|
data will look like above table.
Next step, we will try to visualize the data we already have
|
|
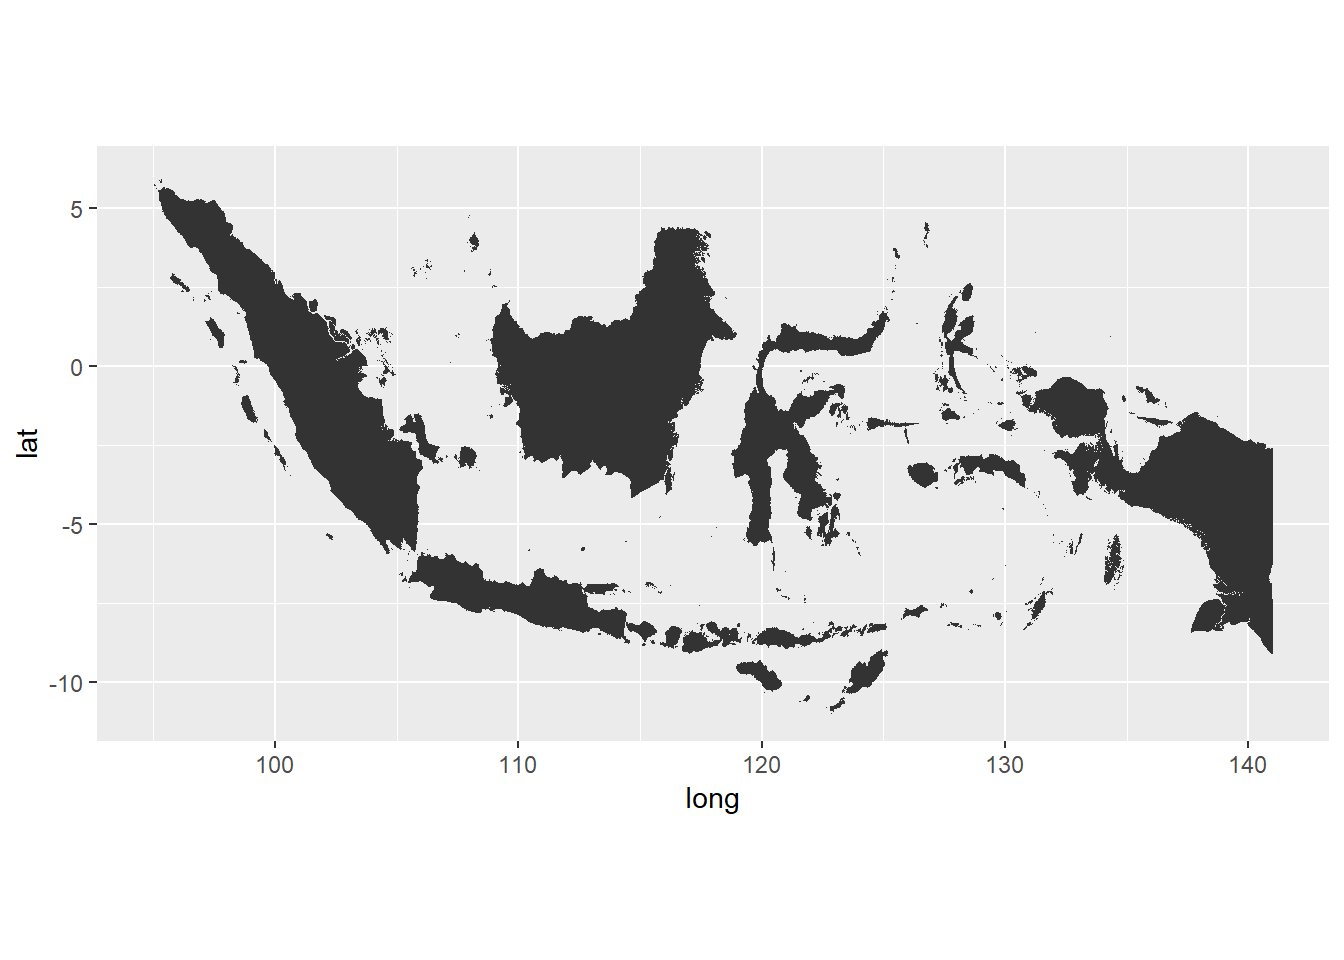
It works!, my data has suitable for ggplot2 format. Let’s make it more colorful by colorize each province.
|
|
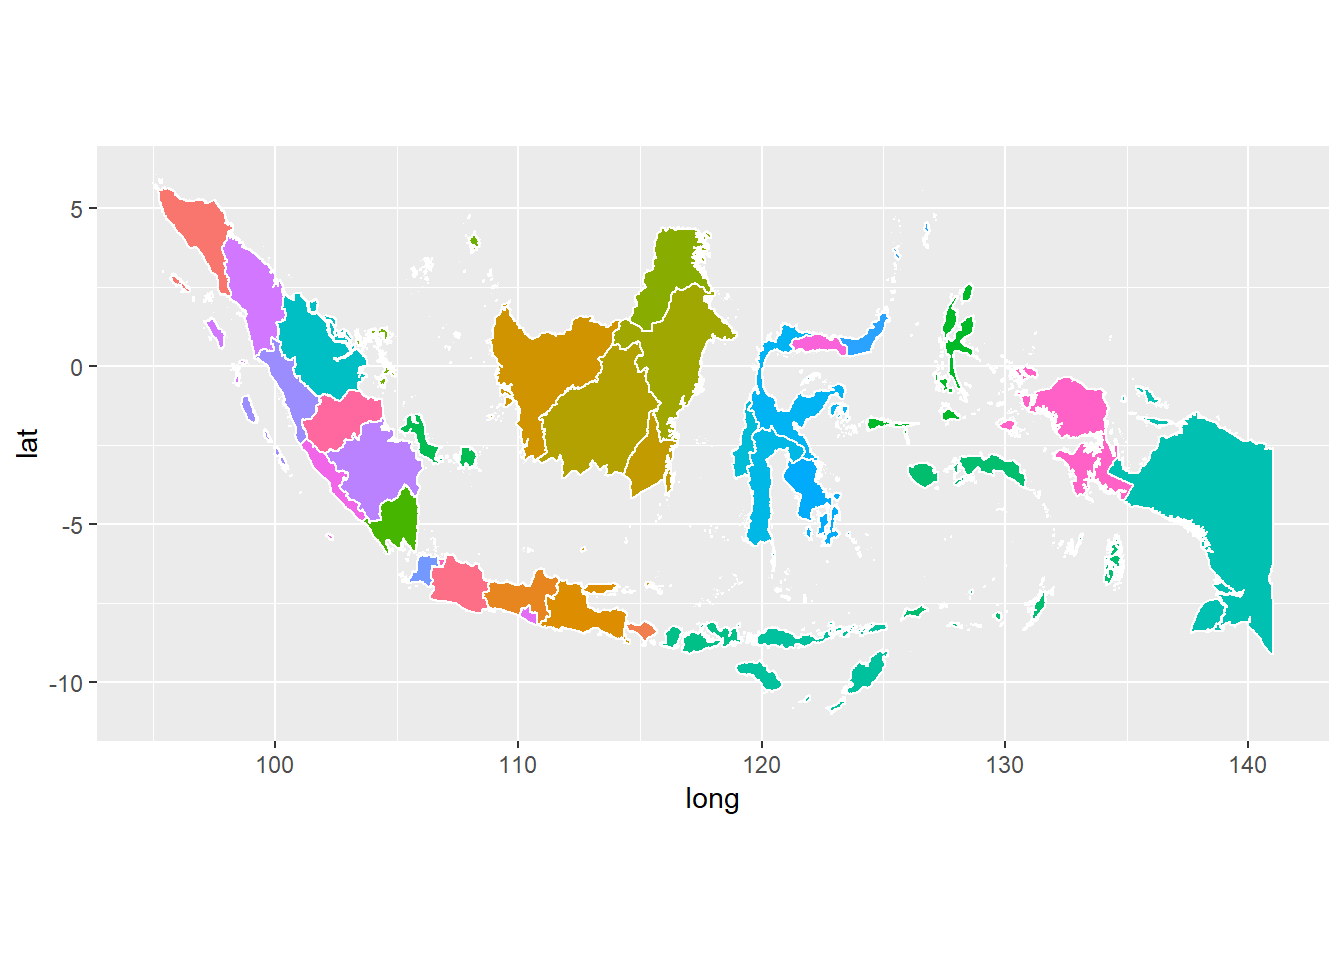
Cool! looks much better. But that’s not the goal of this analysis. Let’s moving forward. Now need to add population density data to complete the analysis.
|
|
to make it more intuitive, let’s change the column name with what it should be.
|
|
population data has two column; provinsi and density with 34 rows fit to the number of province in Indonesia from Aceh to Papua. Next, we need to merge population dataset with idn_shape_df dataset. If you look in idn_shape, the id column in idn_shape dataset represents the province name. So, the id column in idn_shape_df should represents province name too. Then value in id column better we replace by province name.
|
|
Before we join, we notice that id index on idn_shape_df somehow start from 0 while id index on idn_shape. We need transform id on the two tables to be identical.
|
|
|
|
Now shapefile data idn_shape_df are ready. Next let’s join it with Indonesia’s population data we get from BPS.
Since we have replaced value in id column by province name, it’ll be better if we also rename the id column name into provinsi. Then, we will merge population dataset with idn_shape_df using inner_join from dplyr package.
|
|
|
|
idn_pop_density is the final data that will we visualise using ggplot2.
Visualise Indonesia map data
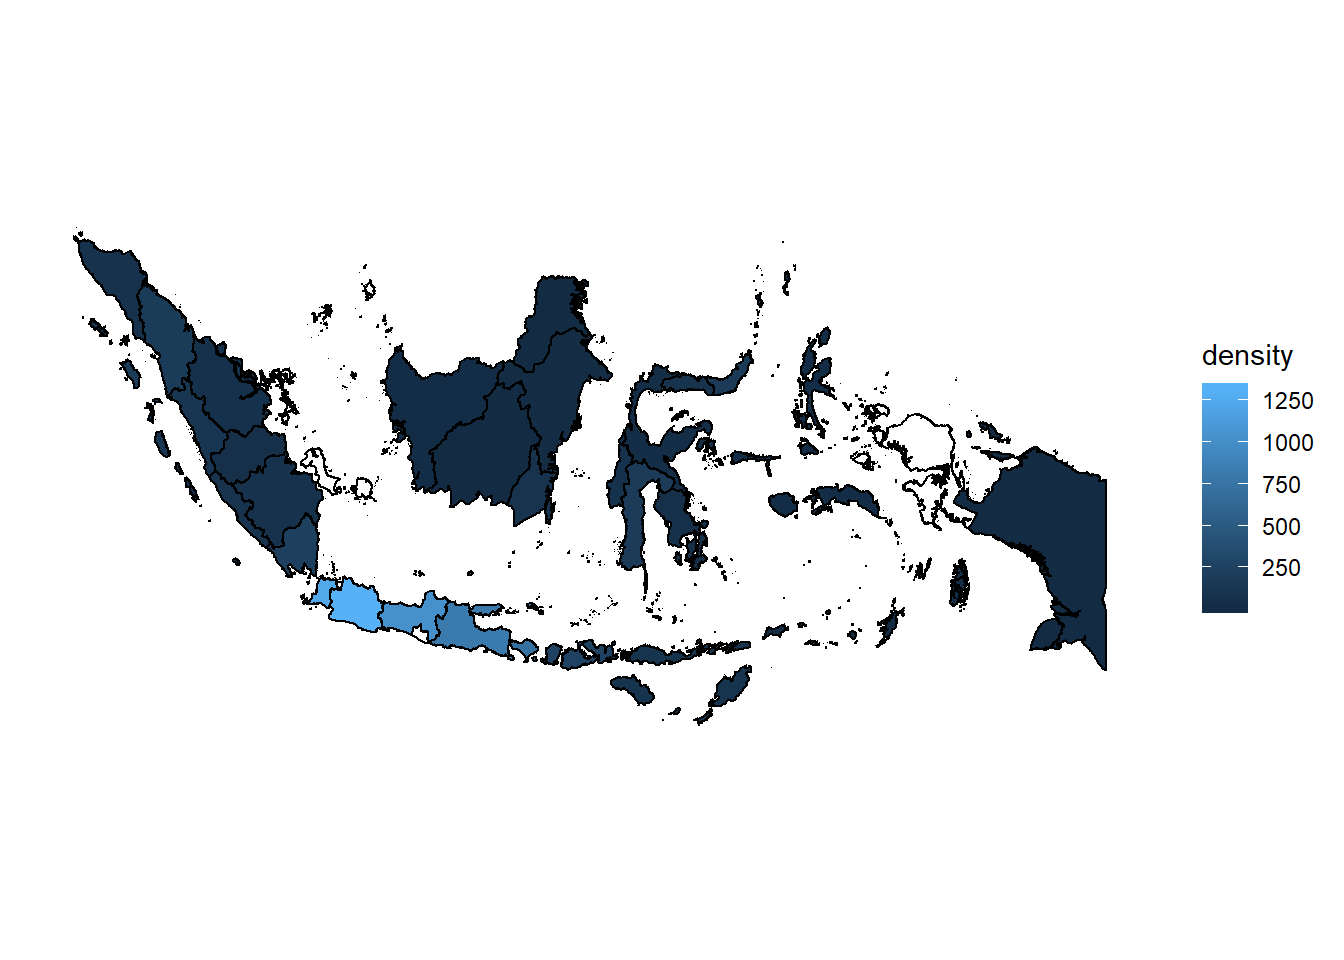
Time to the main part of this analysis, plotting the density map.
|
|
Final touch
Cool! but it looks like it’s hard to discern the different in area. Let’s make it clearer by transforming the value of density by log10 , reseve the density color to make the more dark color indicate the more dense area also change legend title.
|
|
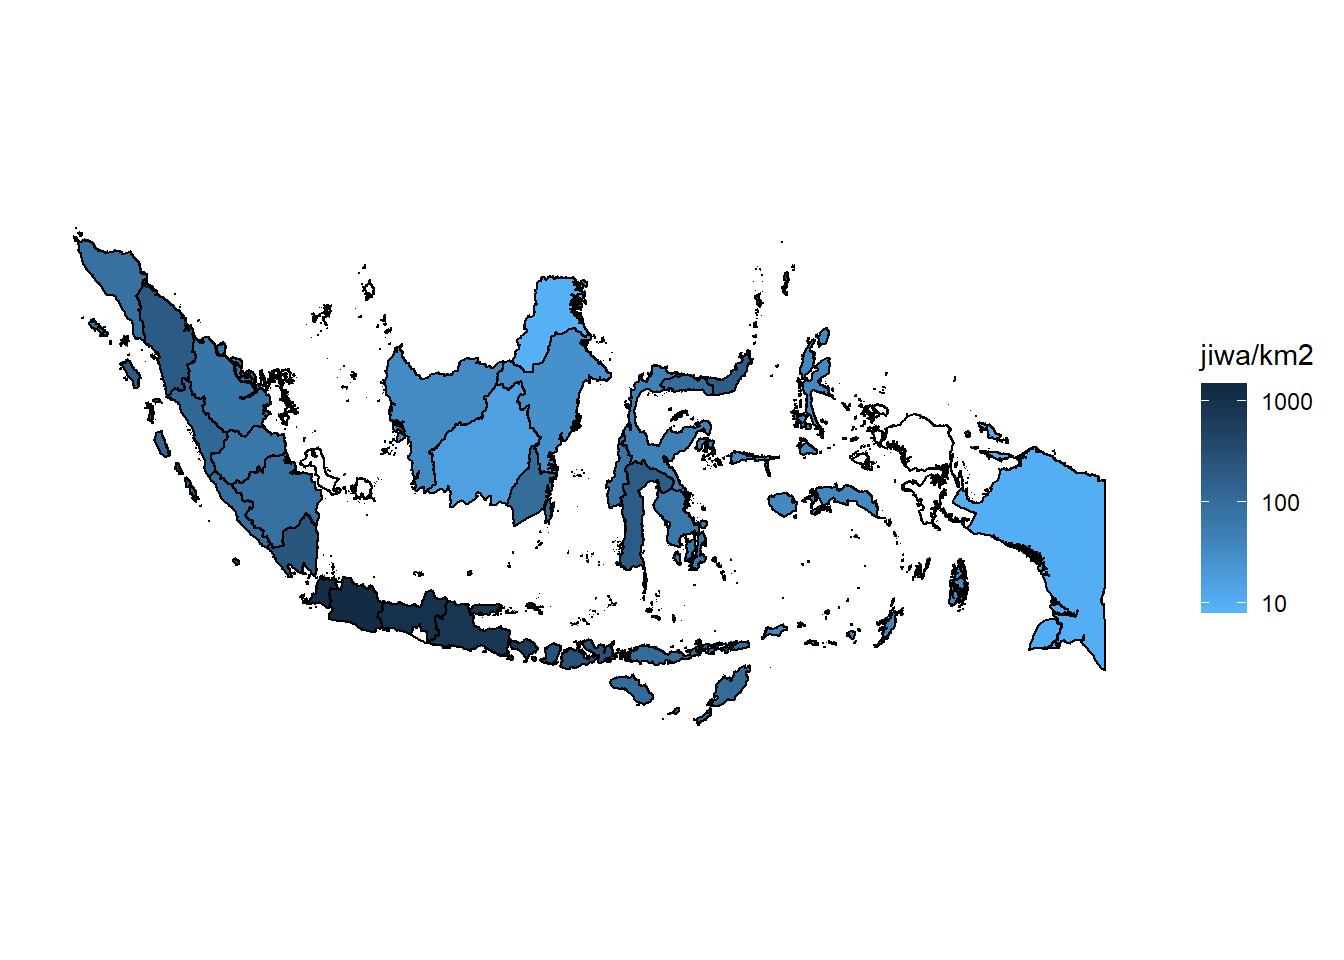 Looks better now. Nothing special with the data as we know that Java has very high population compared to others province/area in Indonesia, and we are not discussing about that point this time. This is just an example of how to visualise map/spatial data especially for Indonesian area using R which is open source (free) tools instead of using paid tools. We can then replace the fill by others value like number of sufferer of certain desaese to map the its spreadness or others data we desire.
Note : If you notice there are some provinces that has white color, It’s because the province name on data from BPS and .shp file has different value. So when we join that two tables by province name, some rows doesn’t match. For example Kep. Riau and Kepulauan Riau, Papua Barat and Irian Jaya Bara, Bangka-Belitung and Bangka Belitung. It needs further processing to handle this may be using regex join etc. But i won’t cover that on this post.
Refference: